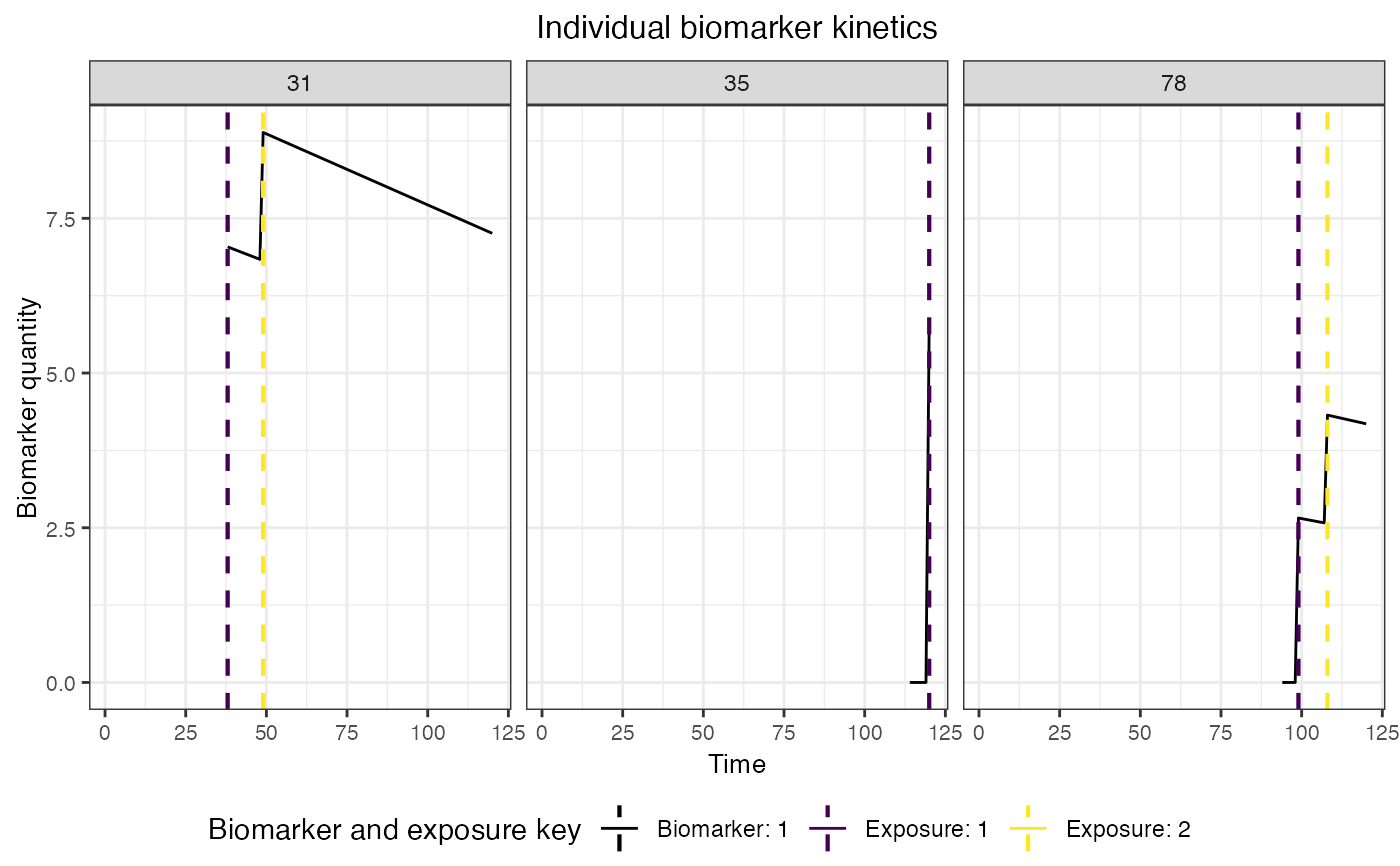
Plot biomarker states and immune histories for a subset of individuals
Source:R/generate_plots.R
plot_subset_individuals_history.RdPlot biomarker states and immune histories for a subset of individuals
plot_subset_individuals_history(
  biomarker_states,
  immune_histories,
  subset,
  demography,
  removal = FALSE,
  heatmap = FALSE
)
Arguments
- biomarker_states
The reshaped data set containing biomarker quantities for individuals at all time steps for each biomarker
- immune_histories
The reshaped data set containing immune history for individuals at all time steps for each exposure event
- subset
The number of individuals you want to plot
- demography
Tibble of removal time for each individual
- removal
Set to TRUE if individuals are removed during the simulation and removal time is present in demogrpahy; defaults to FALSE
- heatmap
if TRUE, returns a heatmap of all biomarker states over time. Overwise plots each biomarker as a line.
Value
A plot of biomarker states and exposure histories for a subset of individuals is returned
Examples
plot_subset_individuals_history(example_biomarker_states,example_immune_histories,
3,example_demography)
#> Warning: Removed 37 rows containing missing values (`geom_line()`).