Plot biomarker quantities for multiple observation times and paired samples
Source:R/generate_plots.R
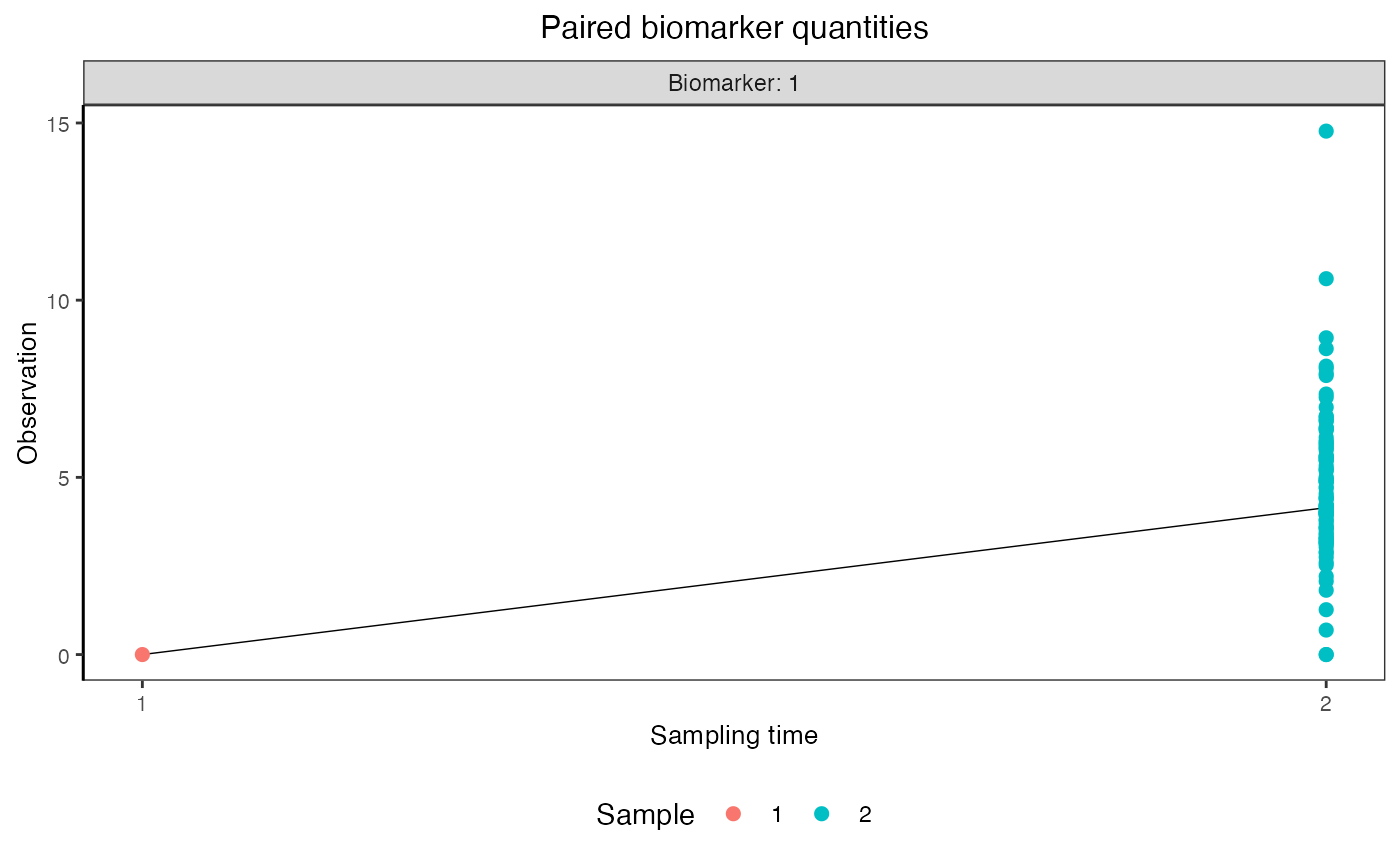
plot_obs_biomarkers_paired_sample.RdThis function should be used when there were multiple time step in which biomarker quantities were observed
plot_obs_biomarkers_paired_sample(
  observed_biomarker_states,
  discretize_times = TRUE
)
Arguments
- observed_biomarker_states
The reshaped data set containing observed biomarker quantities for individuals at all time steps for each biomarker
- discretize_times
if TRUE, plot sampling times as discrete factors. Otherwise, plots sampling time on the x-axis as its raw value.
Value
A plot of observed biomarker quantities for all individuals and biomarkers is returned
Examples
library(dplyr)
example_biomarker_states$observed <- example_biomarker_states$value
example_biomarker_states_subset <- example_biomarker_states %>% dplyr::filter(t %in% c(1,120))
plot_obs_biomarkers_paired_sample(example_biomarker_states_subset)
#> Warning: Removed 99 rows containing missing values (`geom_line()`).
#> Warning: Removed 99 rows containing missing values (`geom_point()`).