Plot Observed Biomarker Quantities For One Observation Time
Source:R/generate_plots.R
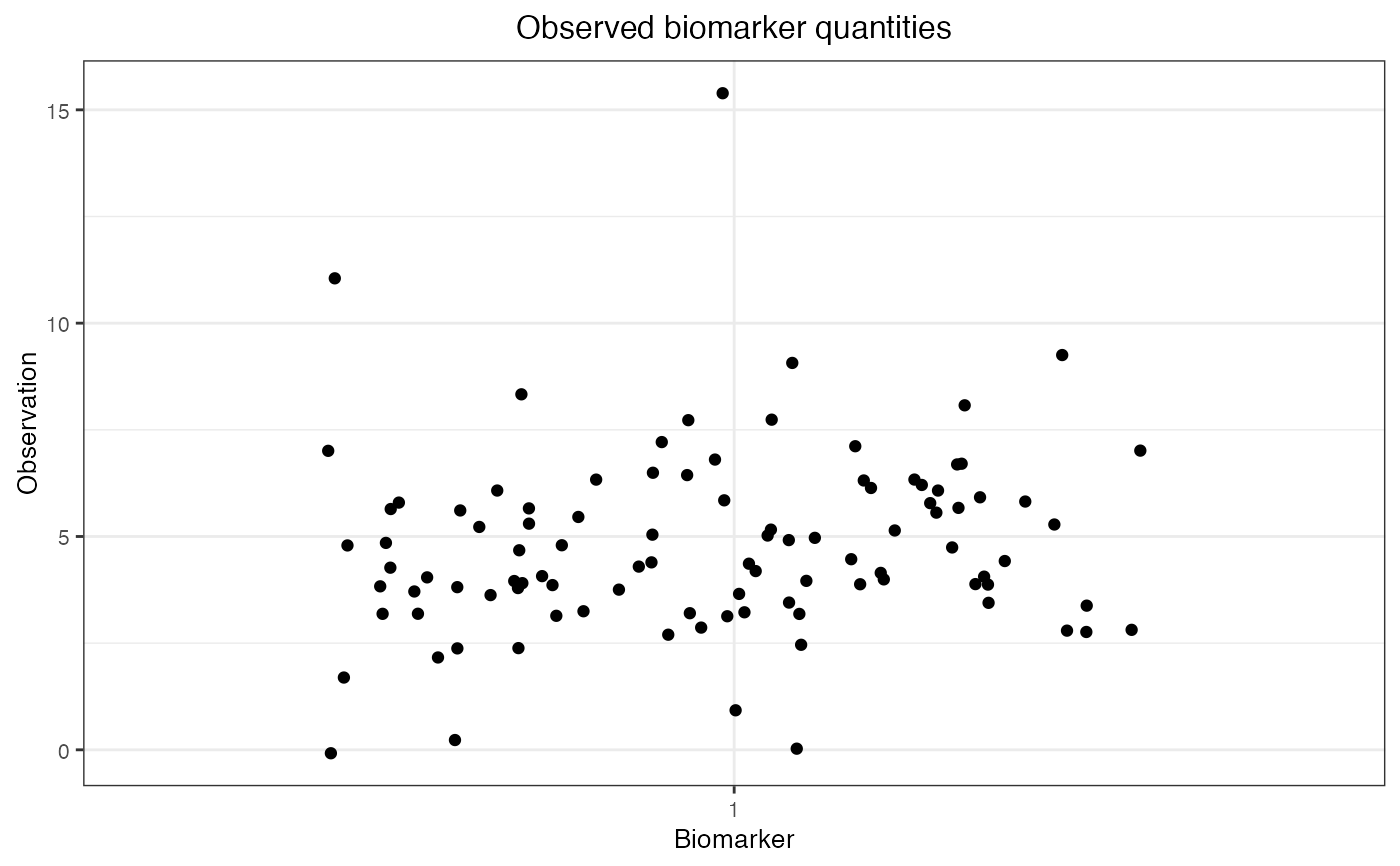
plot_obs_biomarkers_one_sample.RdThis function should be used when there was only one time step in which biomarker quantities were observed
plot_obs_biomarkers_one_sample(
  observed_biomarker_states,
  add_boxplot = FALSE,
  add_density = FALSE
)
Arguments
- observed_biomarker_states
The reshaped data set containing observed biomarker quantities for individuals at all time steps for each biomarker
- add_boxplot
if TRUE, adds a boxplot to the jittered biomarker quantities with median and 75% percentiles
- add_density
if TRUE, adds a smoothed density (violin) plot to the jittered biomarker quantities with 75% quantiles
Value
A plot of observed biomarker quantities for all individuals and biomarkers is returned
Examples
plot_obs_biomarkers_one_sample(example_observed_biomarker_states)