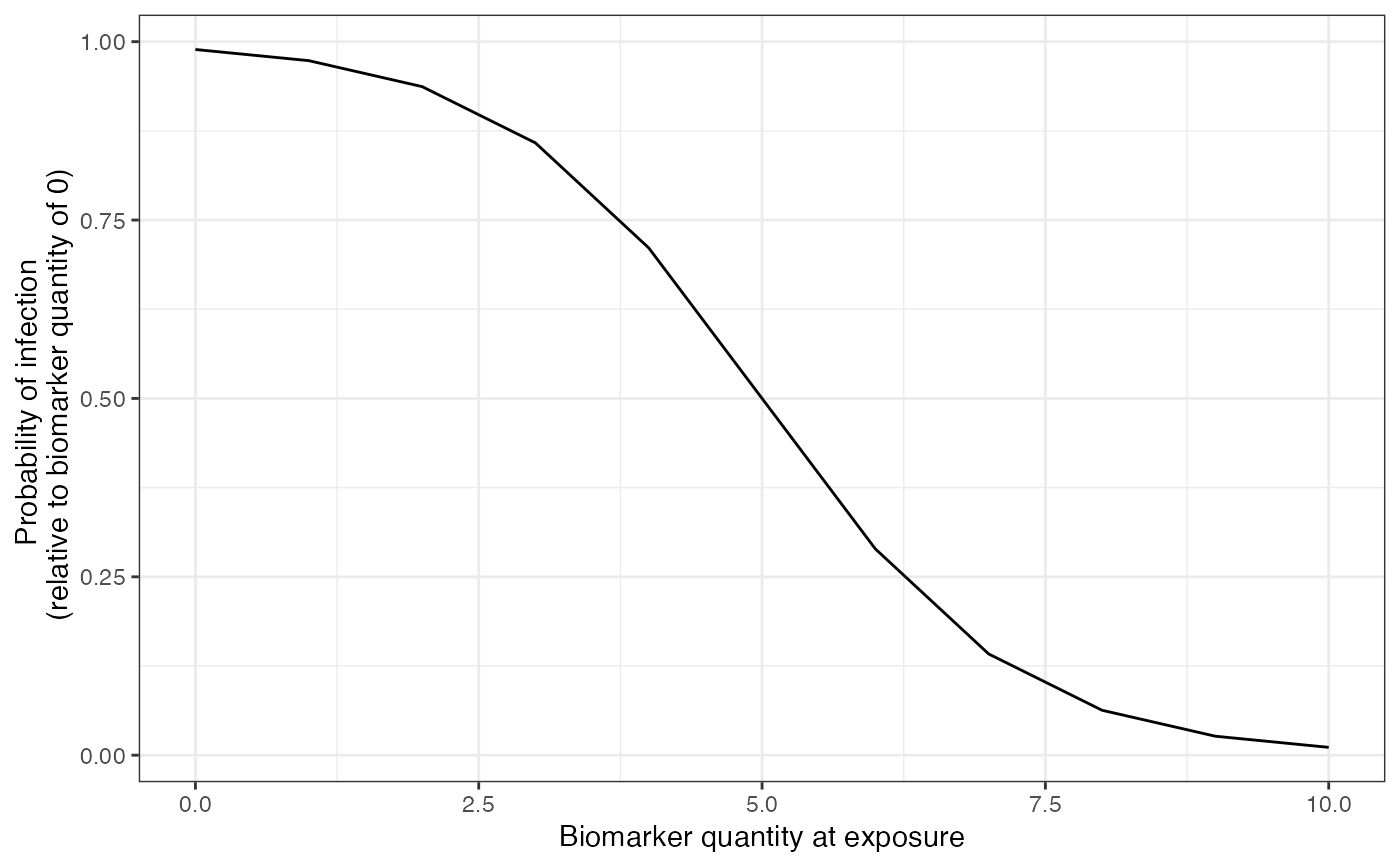
Plot biomarker mediated protection graphs for each pathogen
Source:R/generate_plots.R
plot_biomarker_mediated_protection.RdPlot biomarker mediated protection graphs for each pathogen
plot_biomarker_mediated_protection(
  biomarker_range,
  biomarker_prot_midpoint,
  biomarker_prot_width
)
Arguments
- biomarker_range
The range of possible biomarker quantities an individual can have at exposure
- biomarker_prot_midpoint
The biomarker quantity at which you are 50% protected from infection
- biomarker_prot_width
Determines the shape of the curve
Value
A plot of the probability of infection given an individual's biomarker quantity at exposure
Examples
plot_biomarker_mediated_protection(0:10,5,0.9)