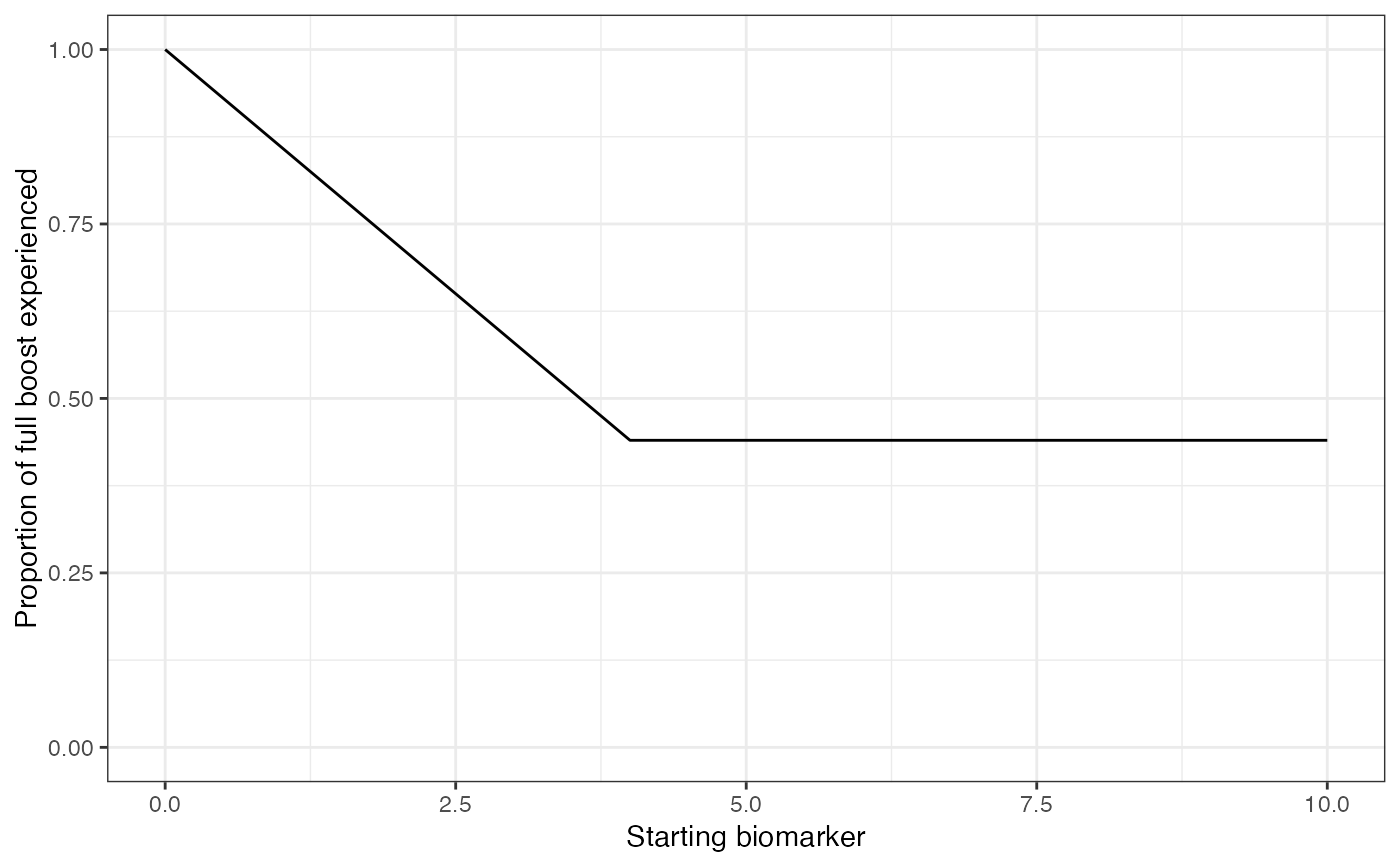
Generate a plot displaying proportion of full boost received at each starting biomarker quantity
Source:R/generate_plots.R
plot_biomarker_dependent_boosting.RdGenerate a plot displaying proportion of full boost received at each starting biomarker quantity
plot_biomarker_dependent_boosting(
  start,
  end,
  by,
  biomarker_ceiling_threshold,
  biomarker_ceiling_gradient
)
Arguments
- start
Lower bound of the x axis
- end
Upper bound of the x axis
- by
Increments at which your x axis will be plotted
- biomarker_ceiling_threshold
The maximum biomarker level an individual can have before their boost is limited in size
- biomarker_ceiling_gradient
(1-A)/B; Where A is the proportion of the full boost received at or above the biomarker_ceiling_threshold (B)
Value
A plot displaying biomarker quantity dependent boosting is returned
Examples
plot_biomarker_dependent_boosting(0,10,1,4,.14)