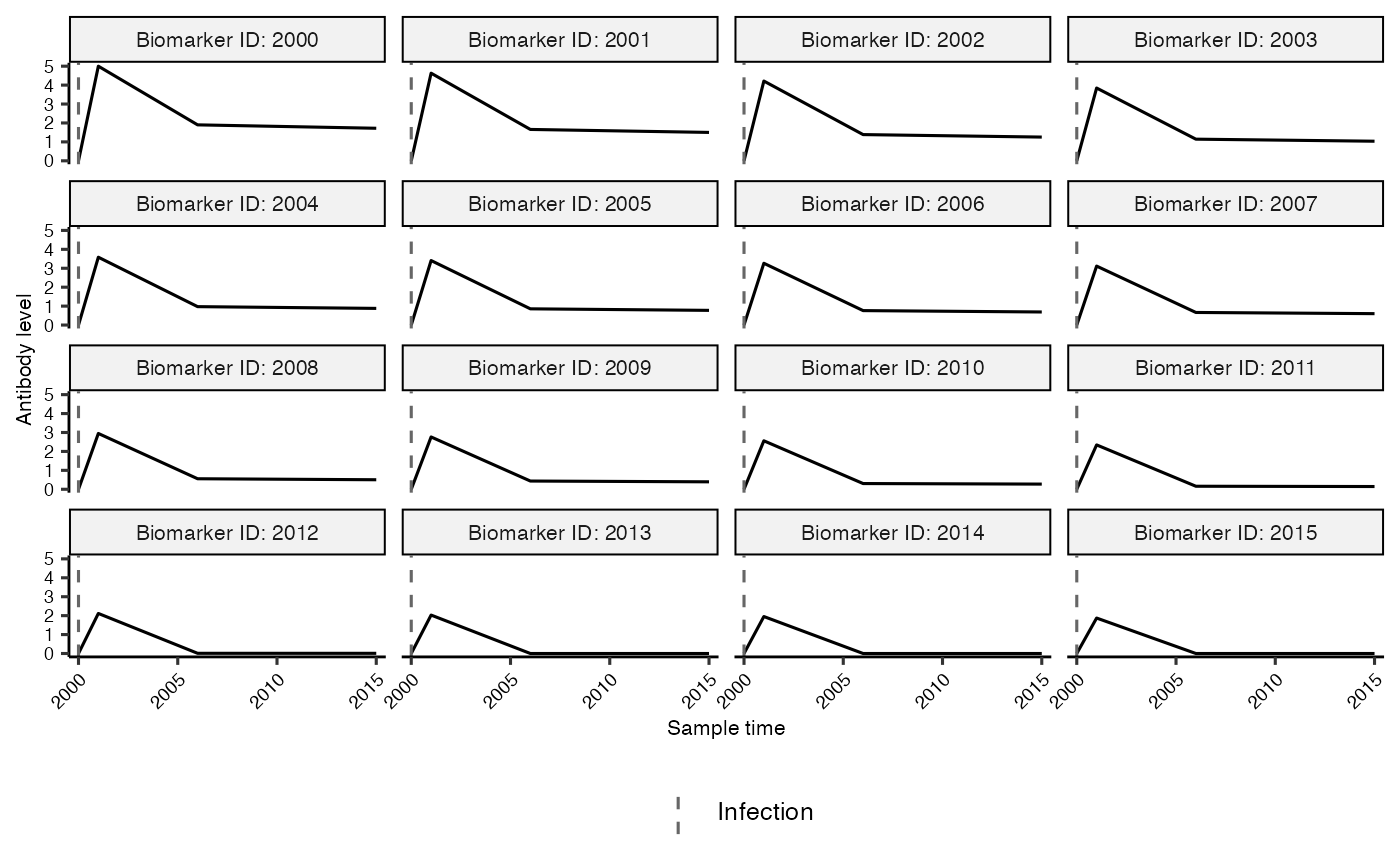
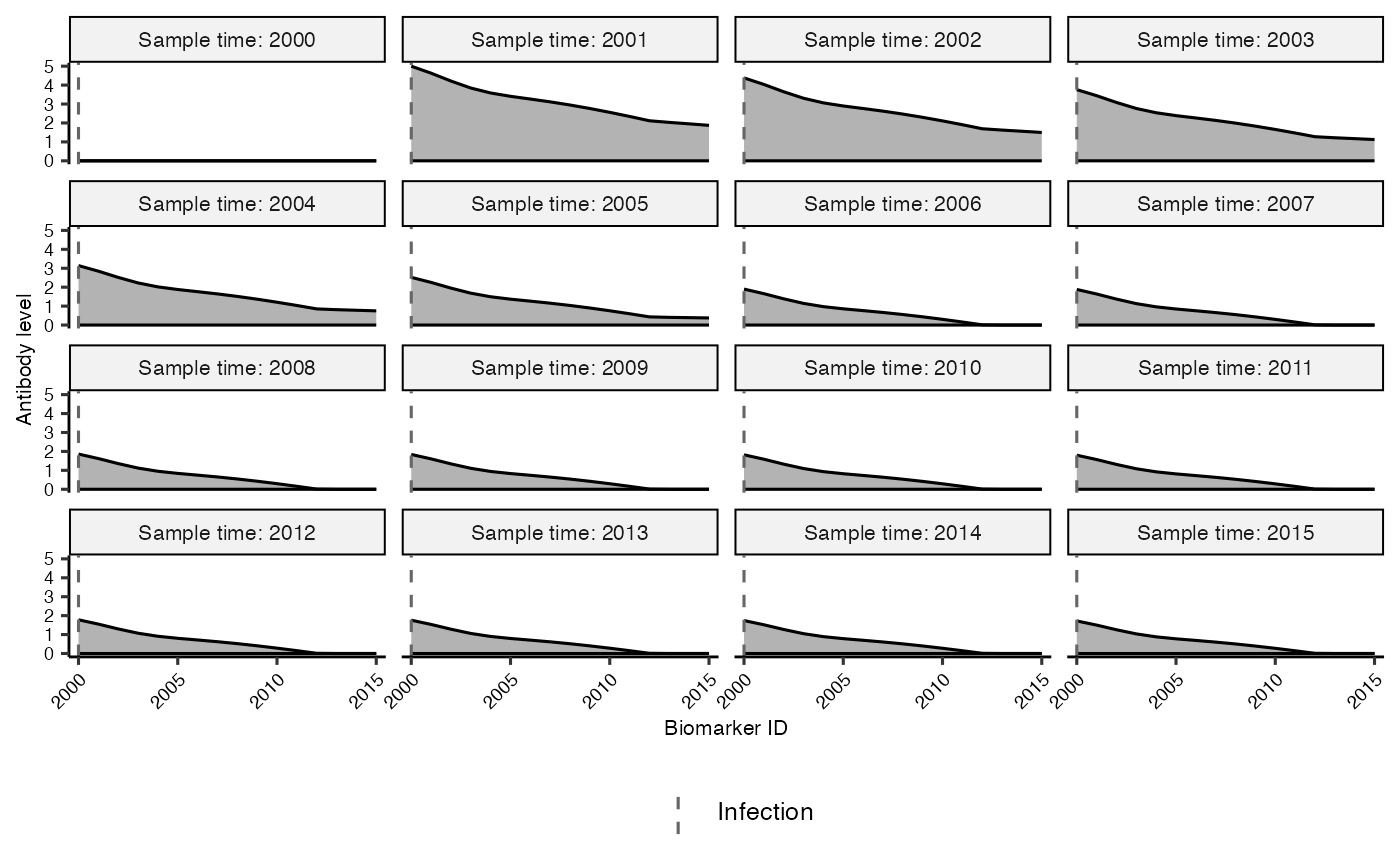
Plots the trajectory of the serosolver antibody model using specified parameters and optionally a specified antigenic map and infection history. If no infection history is supplied, the first supplied model time is used as a default infection time.
plot_antibody_model(
  pars,
  times = NULL,
  infection_history = NULL,
  antigenic_map = NULL,
  exponential_waning = FALSE
)
Arguments
- pars
either the original `par_tab` object (a data frame), or the vector of named model parameters, including `boost_long`, `boost_short`,`boost_delay`,`wane_long`,`wane_short`,`cr_long`, and `cr_short`.
- times
the vector of time points at which to solve the model. Can be left to NULL if these times are included in `antigenic_map`.
- infection_history
the vector of infection times, each of which must be present in `times`. If NULL, an infection is simulated at the first value of `times`.
- antigenic_map
the antigenic map to solve the model with. Can be left to NULL to assume all biomarker IDs have the same antigenic coordinates.
- exponential_waning
Deprecated compatibility argument. The preferred setting is a fixed `exponential_waning` row in `par_tab` when using a parameter table.
Value
If `antigenic_map` is `NULL`, a ggplot object showing simulated antibody kinetics over time. Otherwise, a list with two ggplot objects: the longitudinal antibody kinetics plot and the antibody landscape plot showing simulated antibody kinetics for each biomarker ID, stratified by sample time.